| n this series of memos, I have been guiding you on how to prepare your business for growth post disruption. If you need a recap, you can find all the relevant memos here.
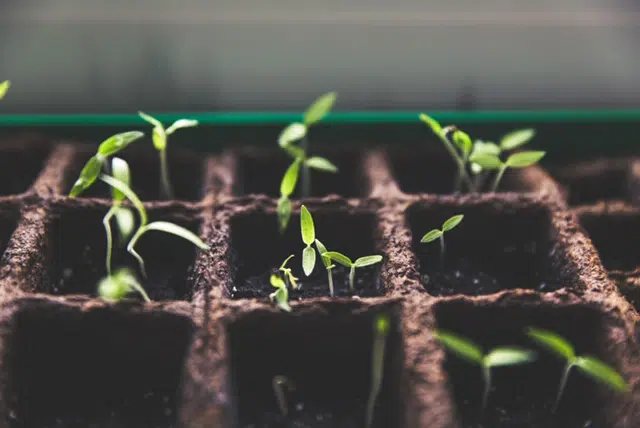
Last week, I told you about my long-term decision to switch to holding consultations virtually. That’s the adaptation which I’ve identified for my own business. How about yours? What have you discovered which might require you to change your products looking ahead? This week, I’ve been planting the seedlings from which I intend to nurture this minor change in my business delivery which affects my Marketing Plan for the remainder of 2020. If you have some changes or developments in mind, please be aware that it will take time for them to bear fruit, hence my analogy with planting seedlings. A seedling contains a young plant that’s developing from a germinated seed. It has several stages in the plant’s life-cycle ahead of it, prior to producing its own seeds. Likewise, our new ideas will require careful nurturing prior to them delivering the revenue which your plan seeks.
As for my own idea to extend my Marketing Clinic into virtual consultations, I have begun by taking the following steps this week, which might directly apply to yours as well:
- Researching relevant opportunities. I encourage you to research and test any solution which you’ve identified during your groundwork phase of preparation for post-lockdown.
- Maintaining an awareness of whenever your new solution might fit a customer’s needs. If it does, be certain that you make them aware of your matching solution. It’s likely that you’ll need to adapt your promotional materials digital and physical to reflect a new offer
- In practice, this has meant that I have been identifying potential clients which are located further afield and giving extra flexibility to my existing clients for them to try this format, if it is appropriate for them. It will take time for any new product or service to become established and profitable. A product has its own life-cycle, like the plant. You can see it described in this chart:
|
